With this next tutorial, we will be creating a bar graph. We will be using the bar graph to compare between quarterly sales, so it’s not important to rank these biggest to smallest like in the previous tutorial. We want our viewers to understand at a glance which quarters are up and which are down. Furthermore, we’ll embellish the bar graph with a custom graphic to connect the data to the actual product.1. Open the same file from the previous tutorial and create a new artboard. WINDOW menu > ARTBOARDS. Click the New Artboard Icon at the bottom of the panel (the Page Turning Icon.)

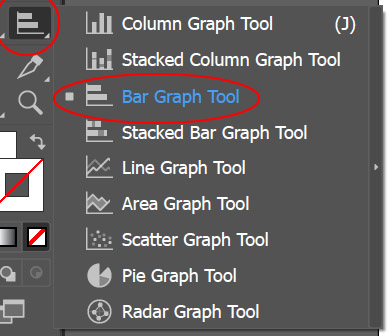
2. Hold the mouse button down on the graph tool icon on the toolbar to select the Bar Graph Tool.
With the Bar Graph Tool draw a large square in the new artboard.
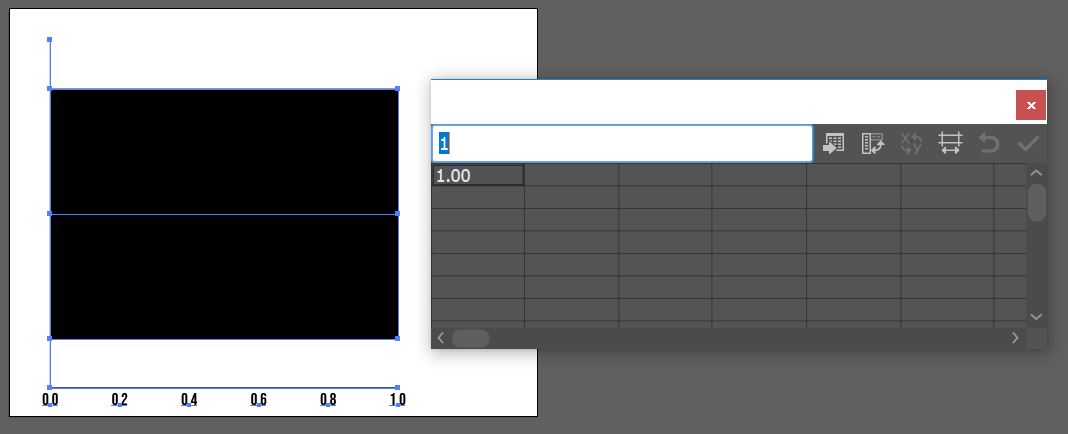
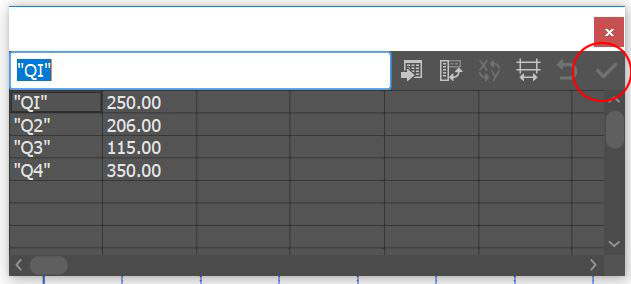
3. Copy the data below from this link and paste it into the Data Window – make sure you have the upper left cell selected (the Illustrator Data Window is not very forgiving.) NOTE: For the bar graph, the vertical axis will be the category axis and the horizontal axis will be the value axis. The names of the categories are in quotes to make them appear on the category axis as opposed to creating a legend.
Click the check mark to apply the data to the Bar Graph. Close the Data Window.
4. Select the graph with the black arrow and in the character panel (or the Properties panel) change the font to Bebas Neue and the size to 22pts.

5. With the graph still selected, go to the OBJECT menu > GRAPH > TYPE. Click on the Graph Options drop down to reveal the Value Axis options. Change the length of the tick marks to Full Width. In the Add Labels section, we want to add a $ Prefix and a K (representing 1000) as the Suffix.

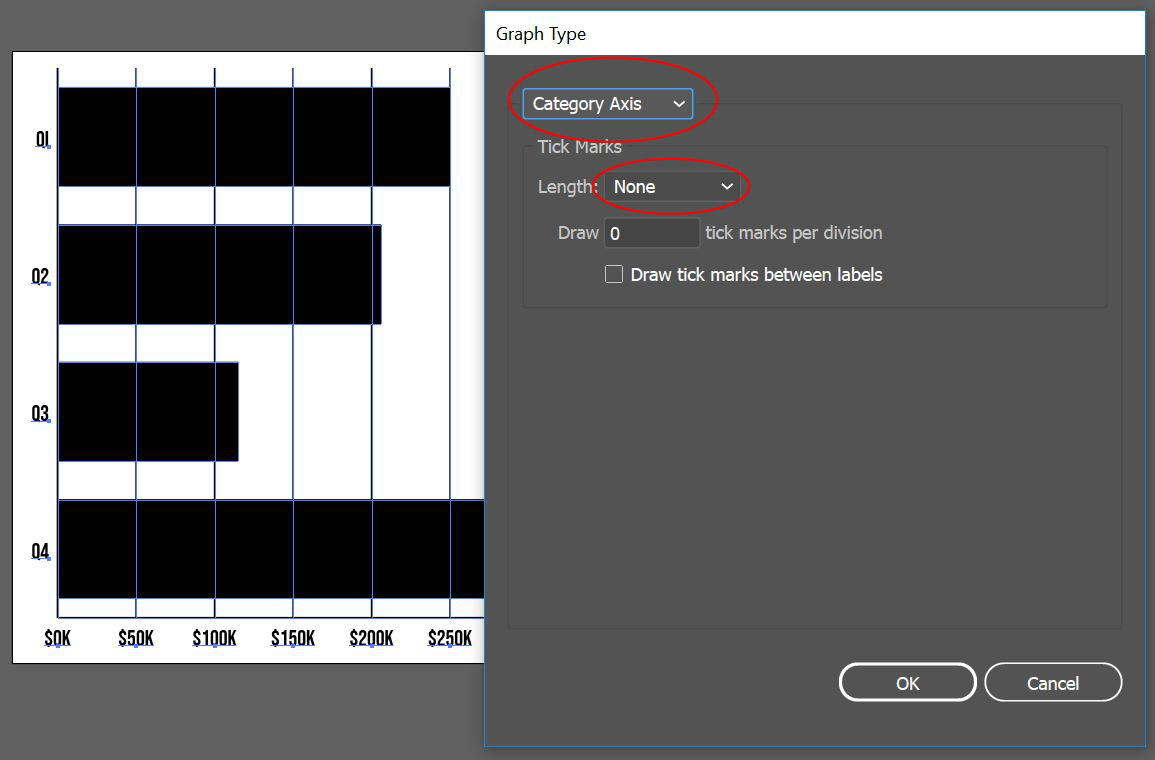
Click on the drop down to reveal Category Axis options and change the tick marks to None. Click OK to close the window.
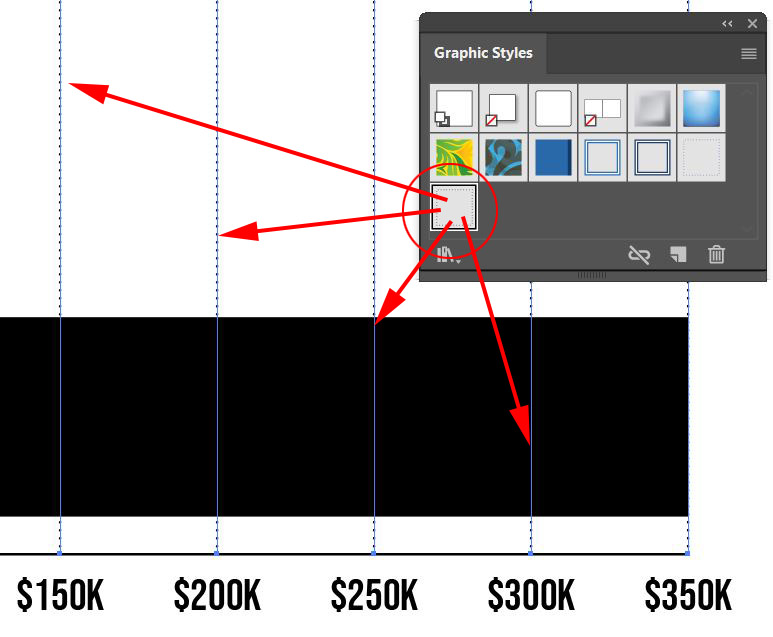
6. Deselect the graph and with the Group Selection Tool (the White Arrow with the plus sign next to it) select one of the vertical tick lines, then click again to select all of the tick lines. Open the Graphic Styles panel and apply the saved dotted line style from the previous tutorial.
Next, we’re going to create a custom graphic to represent sales of coffee within the bar graph. You can download the file here. The icon for the coffee cup was downloaded from the website the Noun Project, a database of icons that are free to use within your projects. If you are planning on using these in your Illustrator project here are a few things to keep in mind. a. You may need to create an account for some of the graphics, its free so go ahead. b. Choose the basic download c. Download the .svg files for use in Illustrator, these are vector files and are perfectly compatible with Illustrator. d. many of the icons are initially very small, so you may need to scale them up for your uses.
7. Open the Coffee Cup.ai file and copy the graphic, paste it into your bar graph file.
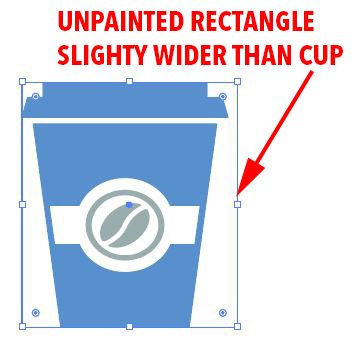
8. The graphic is going to be repeating on the bar graph but we want there to be space between each instance of the graphic.

Zoom into the graphic and draw a rectangle around the shape that is tight to its borders, then drag out the right-hand side a small distance. Change the fill and stroke of the rectangle to None.
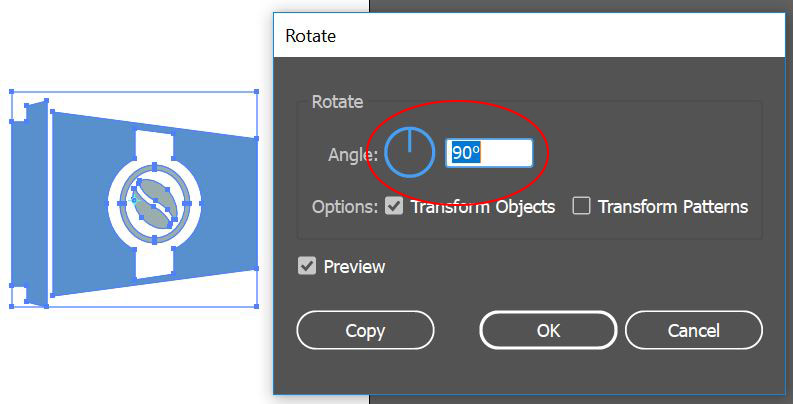
Next, select both the cup and border and rotate it 90 degrees counter-clockwise using the Rotate Transformation or the on-screen transformation tools.
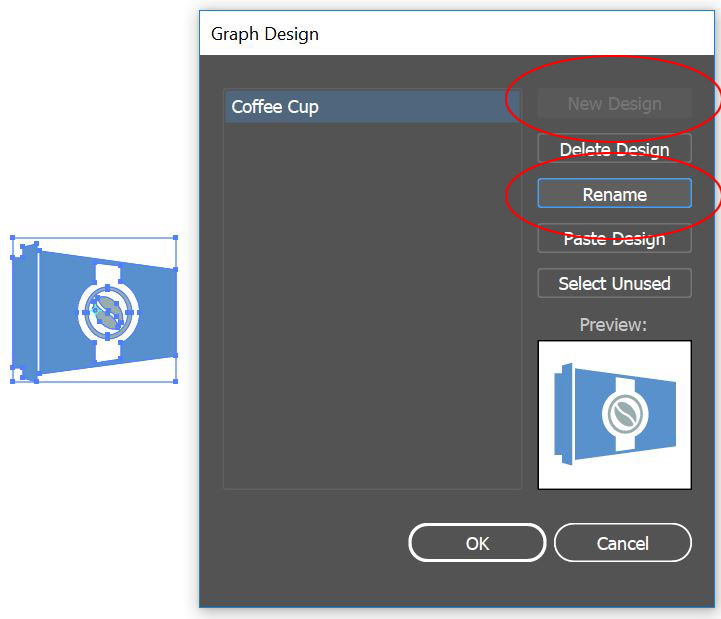
9. Select the rotated coffee cup and the invisible rectangle then go to the OBJECT menu > GRAPH > DESIGN. Click on New Design to add it into your design elements library and then click on rename to name it Coffee Cup.
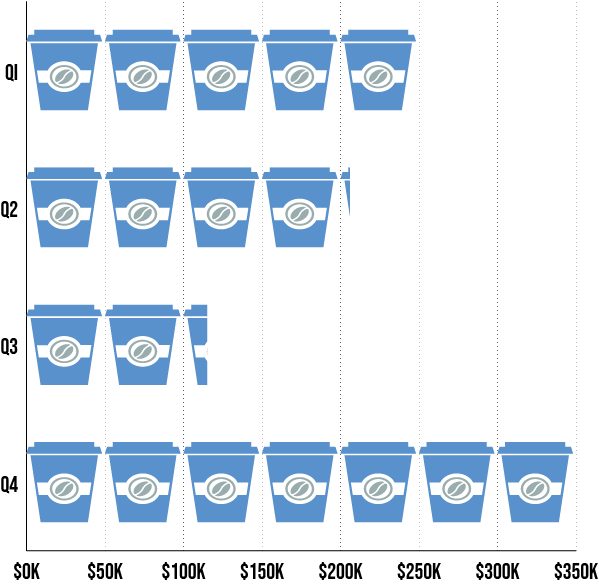
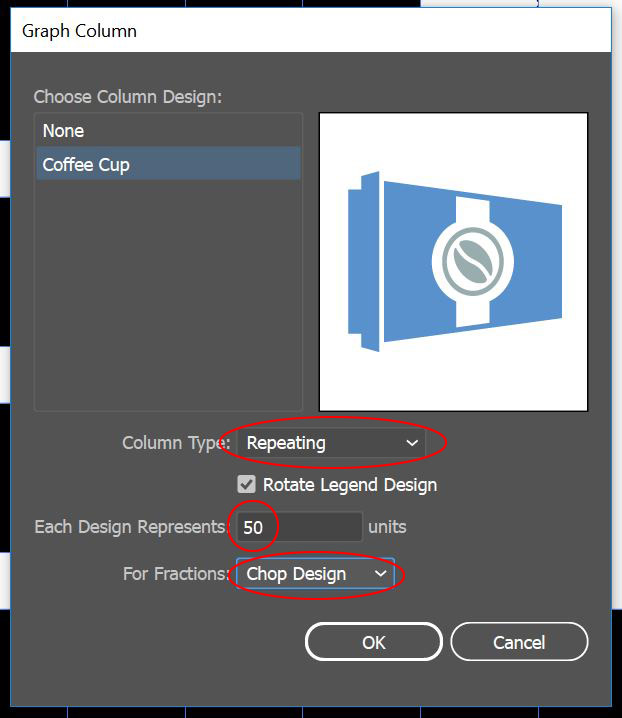
10. Select the Bar Graph then go to the OBJECT menu > GRAPH > COLUMN. Select Coffee Cup as the Column Design then select Repeating as the style. Illustrator needs to know how many units each Coffee Cup represents – type in 50. Finally, where there is a partial unit, we want Illustrator to show a chopped version of the design instead of scaling the instance, select Chop Design for Fractions. Click OK to apply the style.
11. Export the assets in PNG and JPG.
The finished Bar Graph