
For this tutorial, we will be creating an area graph to chart the average weekly sales of take-out coffee in our fictional coffee shop. We will be creating a custom swatch for its fill and further modify the Area Graph to suit our aesthetic needs.

1. Create a new artboard in the same document as your other tutorials.
2. From the Graph Tool on the toolbar, select the Area Graph option and draw a large square on the artboard.

3. Open this Excel spreadsheet and copy the data, then paste it into the Illustrator Data Window, make sure to select the upper left cell. Click the checkbox and close the window.

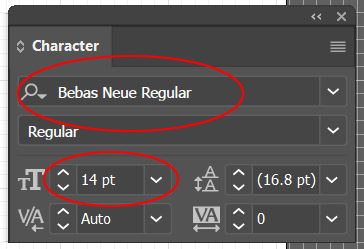
4. With the graph still selected, change the typeface to Bebas Neue Regular and the size to 14pts.
5. If the graph already has the full horizontal and vertical ticks you can skip to Step 6. With the graph still selected go to the OBJECT menu > GRAPH > TYPE and click on the Graph Options drop down to reveal Value Axis, change Tick Marks Length to Full. Click on the drop down again to reveal Category Axis and change Tick Marks to Full. Click OK.

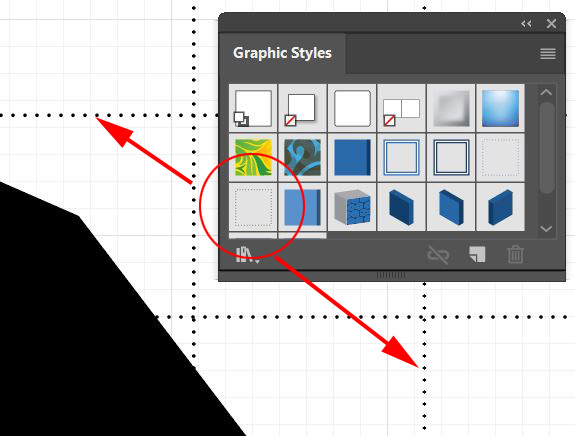
6. With the Group Selection Tool (the White Arrow with the Plus Sign next to it) double click on one of the horizontal tick marks and go to the WINDOW menu > GRAPHIC STYLES and select the Dotted Line style from the earlier tutorial. Deselect everything by clicking out in a blank area of the screen then double-click on one of the vertical tick marks and apply the same style.
7. Next, we’ll create a custom pattern swatch to use as the fill for the area graph. Download and open the Take Out Coffee Cup.ai. Copy the cup and paste it into the Area Graph document. Change the fill color to Blue 2 (from previous graph tutorials in this set.)

8. With the cup still selected open WINDOW > TRANSFORM (or use the Properties Panel) and change the width to 34 pts.

9. With the rectangle tool, click on the screen to make a rectangle that is 36 pts wide by 42 pts high. Change the fill color to Blue 1 and the stroke to None. With the rectangle still selected go to the OBJECT menu > ARRANGE > SEND TO BACK.

10. Select both the rectangle and the coffee cup and open the Align panel – WINDOW menu > ALIGN (the align panel will also pop up on the properties panel when multiple objects are selected) Align the left and bottom edges.

11. With both objects selected, double-click the scale tool from the toolbar and scale the objects 50%.

12. With both objects selected, open the Swatches panel and drag them both into the Swatches panel.

13. With the White Arrow, select the Area Mass from the Area Graph and change the fill to your new swatch, change the stroke to None.

14. The Area Graph doesn’t fill out the entire graph area, to modify this and make it more visually appealing, with the white arrow select the anchor point on each cornes and stretch them out to the sides of the graph.

15. By doing the last step, the Area Graph now covers the Vertical and Horizontal edges of the graph. The easiest way to resolve this apart from ungrouping all of the elements and moving this backward and forwards is to simply draw in some new lines. With nothing selected type D on your keyboard, then select the line tool and change the stroke width to 6pts, draw a vertical line down the side of the graph, then draw a horizontal line at the base. Hold down Shift as you drag out the line to ensure the lines are perfectly vertical and horizontal.

16. Select both lines – select one with the Black arrow, hold down Shift and then select the other – and go to the OBJECT menu > PATH > JOIN to connect the corner.

17. Select both the graph and the newly joined lines and go to the OBJECT menu > GROUP, drag it into the Asset Export window and export as a JPG and PNG.
Photoshop, Illustrator and InDesign Tutorials
