

This tutorial is similar to the last one, except it uses a line graph to compare quarterly sales between two years.

1. Create a new artboard in the same document as your other tutorials
2. From the Graph Tool on the toolbar, select the Line Graph option and draw a large square on the artboard.


3. Open this Excel spreadsheet and copy the data, then paste it into the Illustrator Data Window, make sure to select the upper left cell. Click the checkbox and close the window.

4. With the graph still selected, change the typeface to Bebas Neue Regular and the size to 18pts.
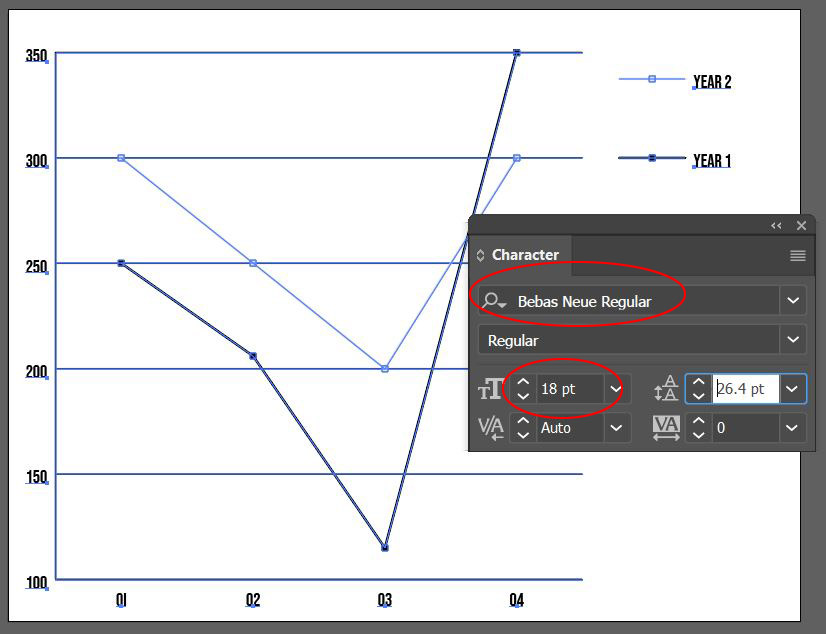
5. With the graph still selected go to the OBJECT menu > GRAPH > TYPE and click on the Graph Options drop down to reveal Value Axis, change Tick Marks Length to Full. Click on the drop down again to reveal Category Axis and change Tick Marks to Full. Click OK.

6. With the Group Selection Tool (the White Arrow with the Plus Sign next to it) double click on one of the horizontal tick marks and go to the WINDOW menu > GRAPHIC STYLES and select the Dotted Line style from the earlier tutorial. Deselect everything by clicking out in a blank area of the screen then double-click on one of the vertical tick marks and apply the same style.

Similar to the previous tutorial, we are going to change components of the graph to clearly describe their meaning. We will create two line styles for the graph as well as two markers to designate peeks and valleys.
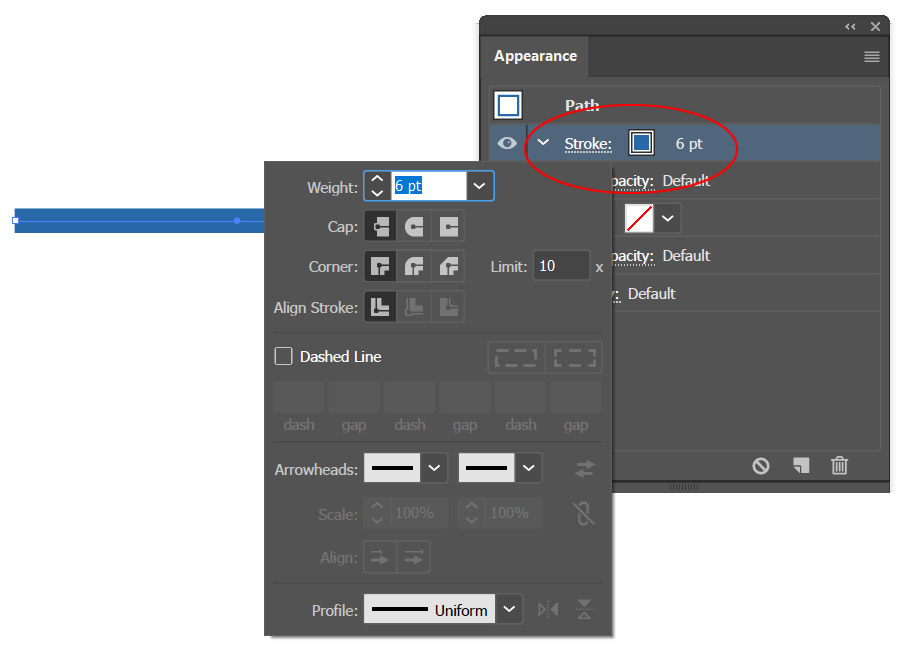
7. Type D on your keyboard to get to your default colors. Then, draw a short straight line, the size and length doesn’t matter. Open the Appearance Panel – WINDOW menu > APPEARANCE. With the line selected, change the fill to none and the stroke to Blue 1 with a weight of 6 pts.
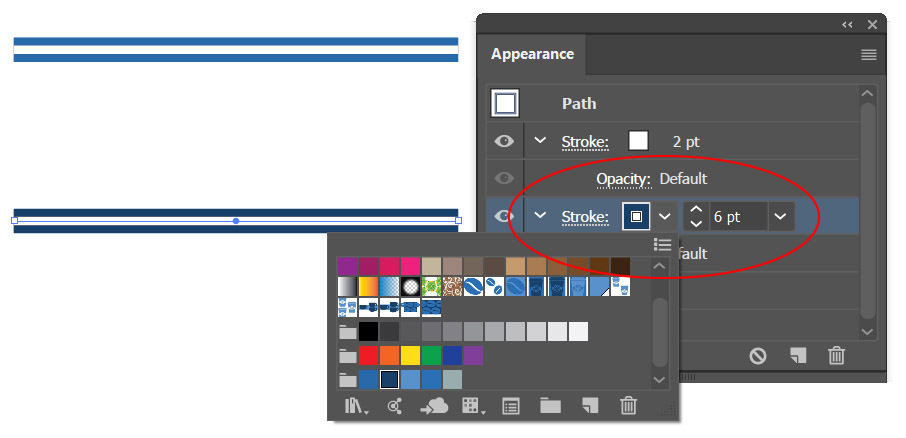
8. With the line still selected, click on the add new stroke icon at the bottom of the Appearance Panel (or from the panel’s menu) and change the top stroke to white and the weight to 2pts.

9. Copy the line. In this copy, change the base stroke to Blue 3.
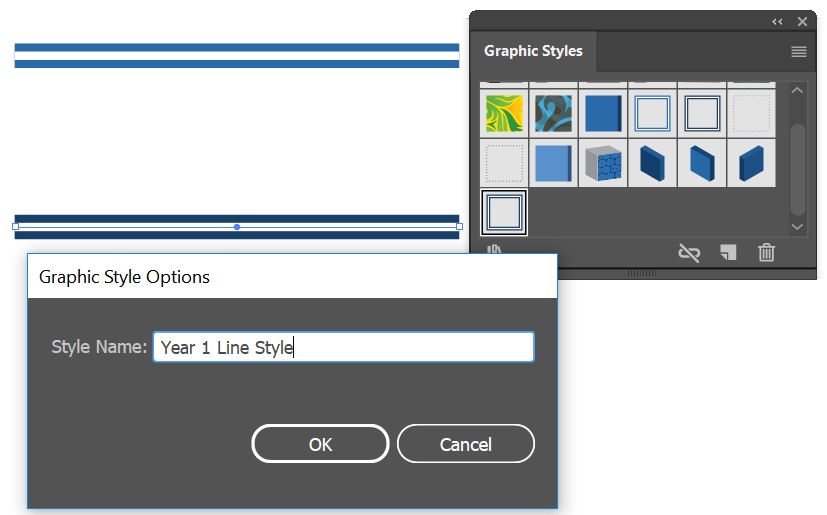
10. With the new stroke selected, go to the WINDOW menu > GRAPHIC STYLES panel and click on the New Graphic Style icon, then double click the thumbnail of your new style and name it Year 1 Line Style. Do the same for the previous line style and name it Year 2 Line Style.
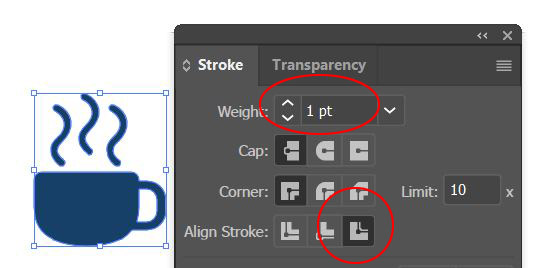
11. Download the Coffee Cup.ai file, open it and copy the icon into your Comparison Line Graph artboard. Double click the scale tool on the toolbar and scale it down 50%.

Give the cup a white stroke of 1 pt and set the stroke to Outside. This will be used as the marker for our graph.
12. Zoom into one of the markers on the graph, with the Group Selection Tool single click on a marker and then go to the EDIT menu > COPY. Move to an empty area of your artboard and paste it there. Change the fill and the stroke of the marker to None.
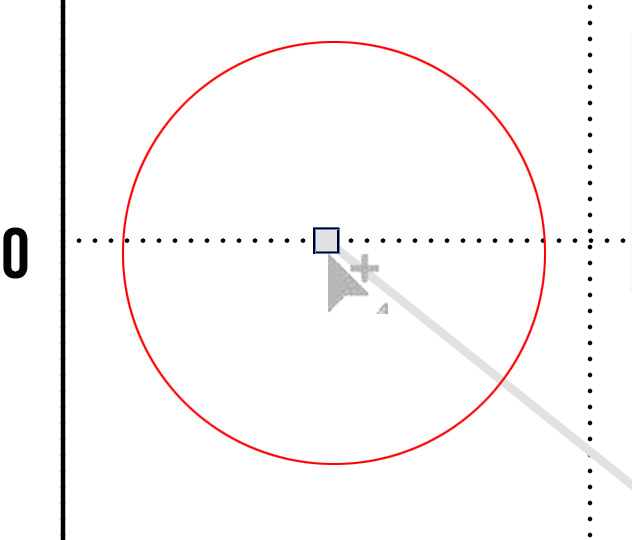
13. Move the coffee cup icon so that the marker is inside the cup area. If you cannot see the marker because it is invisible, go to the VIEW menu > VIEW OUTLINES and move it to the correct position.

With the coffee cup selected go to the OBJECT menu > ARRANGE > BRING TO FRONT. Go back the VIEW menu > GPU PREVIEW to get out of outline mode.
14. ALT/OPT drag a copy of the cup and the marker and change the fill of the new cup to Blue 1.

15. Select the first cup and marker, then go to the OBJECT menu > GRAPH > DESIGN, add it as a New Design and then rename it Year 1 Marker. Click OK. Do the same with the second marker and name it Year 2 Marker.

16. With the Group Selection Tool, triple-click on one of the black lines within the graph and apply the Year 1 Line Style from the Graphic Styles Panel. Deselect. Triple-click on one of the gray lines and apply the Year 2 Line style. Deselect everything again.

17. With the Group Selection Tool, triple-click on one of the markers on the darker line then go to the OBJECT menu > GRAPH > MARKER and select the Year 1 Marker. Deselect. Triple-click on one of the markers on the lighter line then go to the OBJECT menu > GRAPH > MARKER and select the Year 2 Marker.

18. Select the Comparison Line Graph and drag it into the Asset Export window and export as a JPG and PNG.